Understanding trading patterns for beginners
Chart patterns are like the horoscopes of the trading world, except instead of predicting your love life, they predict whether your money’s about to do a backflip or belly flop. These patterns head and shoulders, triangles, flags, and the cup and handle are basically the market’s way of whispering, “bro, something’s about to go down… or up… or sideways,” chart patterns help traders spot potential price movements based on historical behaviour. Do they make a difference? Yes if used the right way, Can the patterns still be wrong? Yes Also different economic factors that affects the chart leaving patterns in limbo. Patterns can help you time your entries and exits better than a back flipping ninja. Just remember: even the prettiest pattern won’t save you from FOMO and bad coffee fueled decisions.
Bullish Setups to Watch For:
1. Bull Flags & Pennants

Bull flags and pennants are continuation patterns that typically appear after a strong upward price movement. These patterns represent a brief pause or consolidation before the trend resumes in the same direction upward.
Bull Flag: This pattern looks like a small downward sloping channel or rectangle that forms after a steep price increase. The "flagpole" is the sharp rise in price, while the "flag" is the consolidation phase where price moves in a tight range, often slightly downward or sideways.
Bull Pennant: Similar to the bull flag, but instead of a parallel channel, the consolidation takes the shape of a small symmetrical triangle. The price action converges, creating a pennant shape, again after a strong upward move (the flagpole).
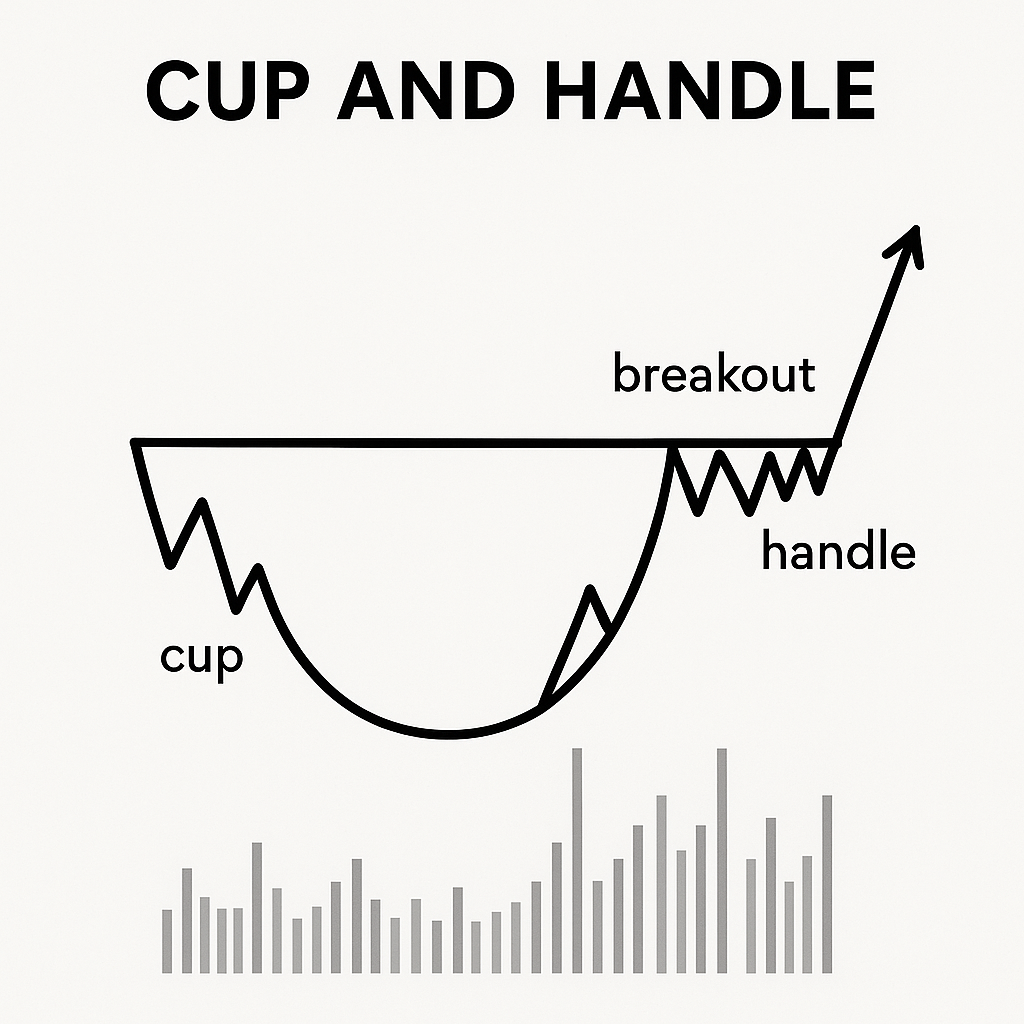
2. The Cup and Handle is a classic bullish continuation pattern that signals a potential breakout to higher levels after a period of consolidation. It often forms after an established uptrend and represents a period of accumulation before the next leg higher.
The Cup: The cup resembles a "U" shape, indicating a gradual rounding bottom. It shows a shift in market sentiment from bearish to bullish. Ideally, the two sides of the cup are roughly equal in height and duration, and the bottom is smooth and rounded rather than V-shaped.
The Handle: After the cup is formed, a slight pullback or sideways movement creates the handle. This part typically slopes downward or moves sideways and lasts a shorter period than the cup. The handle reflects a short term consolidation or shakeout before the next move.
3. Breakouts from Consolidation Zones
Breakouts from consolidation zones are powerful technical signals that occur after a period of price stagnation. These zones often represent areas where buyers and sellers are in balance, causing price to move within a tight range. When the balance tips especially after multiple failed rejections a breakout can lead to a strong directional move.
Consolidation Zone: This is typically a range bound area where price oscillates between support and resistance. It can take the shape of a rectangle, with a flat top (resistance) and a flat bottom (support), or sometimes just a horizontal ceiling being tested repeatedly.
Flat Tops / Horizontal Resistance: A key feature of bullish consolidation is repeated tests of a horizontal resistance level (flat top) without breaking through. Each touch chips away at the resistance, weakening it over time.
Bearish Setups to Watch For:

1.Rising Wedge
The Rising Wedge is a deceptive and often bearish chart pattern. At first glance, it appears bullish because price is making higher highs and higher lows. However, the key is in the details: the highs are rising slower than the lows, causing the trend lines to converge a sign of weakening momentum.
Converging Trend Lines: Both the support and resistance lines slope upward, but the support line (connecting higher lows) rises faster than the resistance line (connecting higher highs). This causes the wedge to narrow as price moves higher.
Loss of Momentum: The shrinking space between swings shows that buyers are losing control and the strength of the uptrend is fading
Entry Signal: A break and close below the lower trend line on increased volume is usually the trigger for short positions.
Stop Placement: Stops are often placed above the most recent swing high within the wedge.
Target: The expected move is typically the height of the wedge projected downward from the breakdown point.
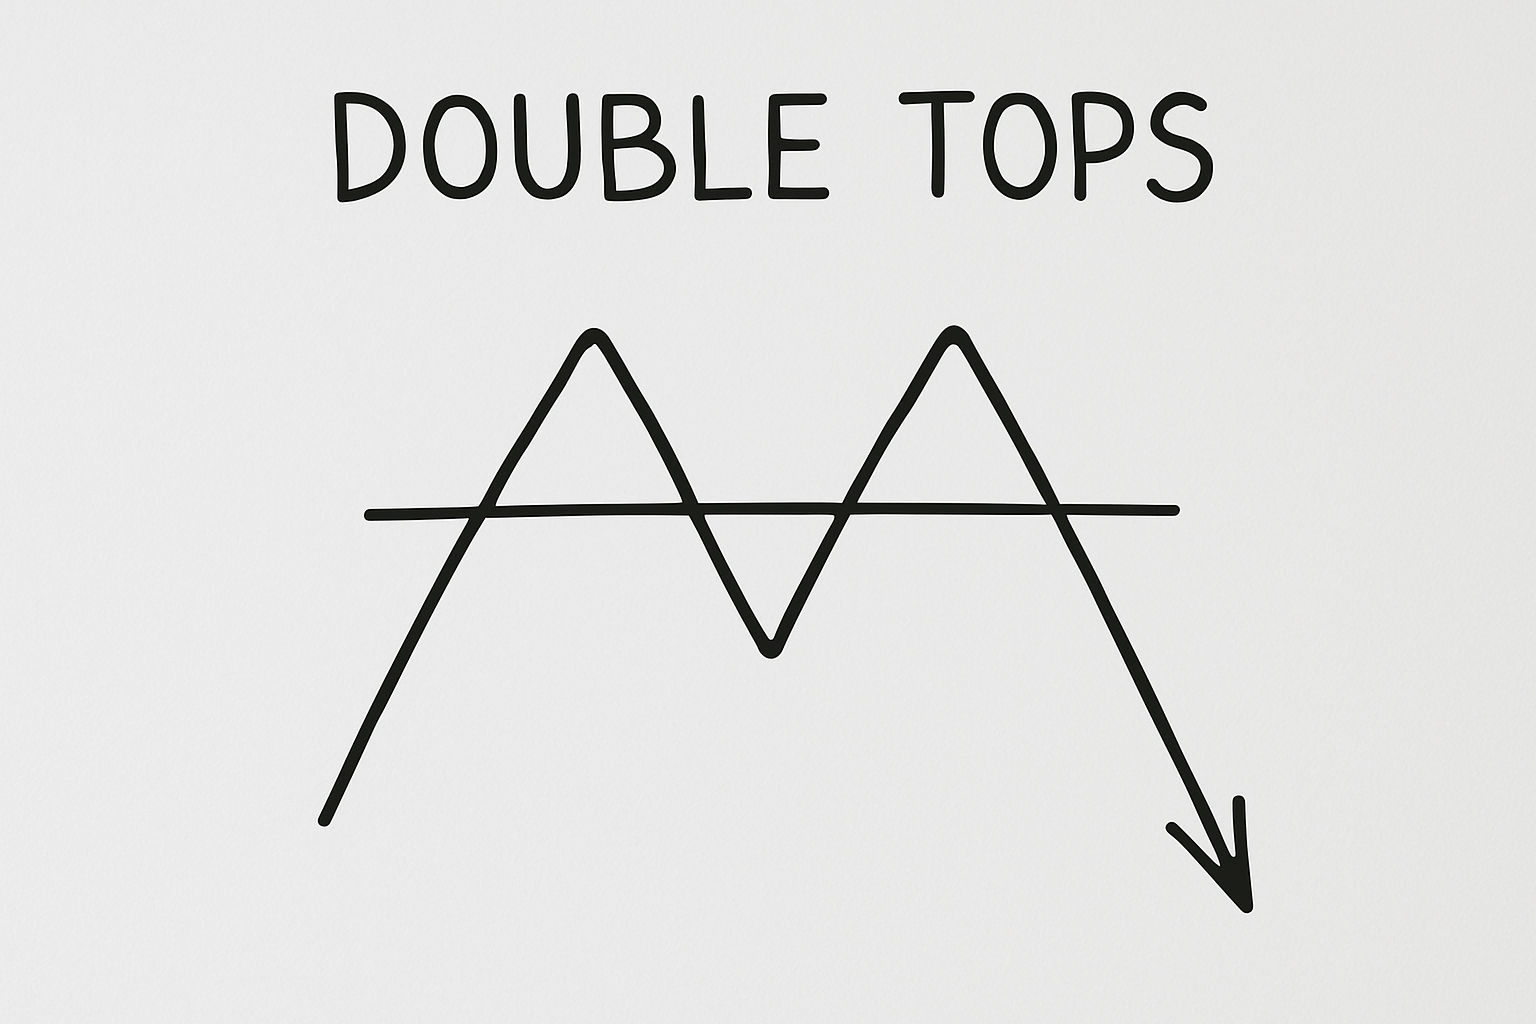
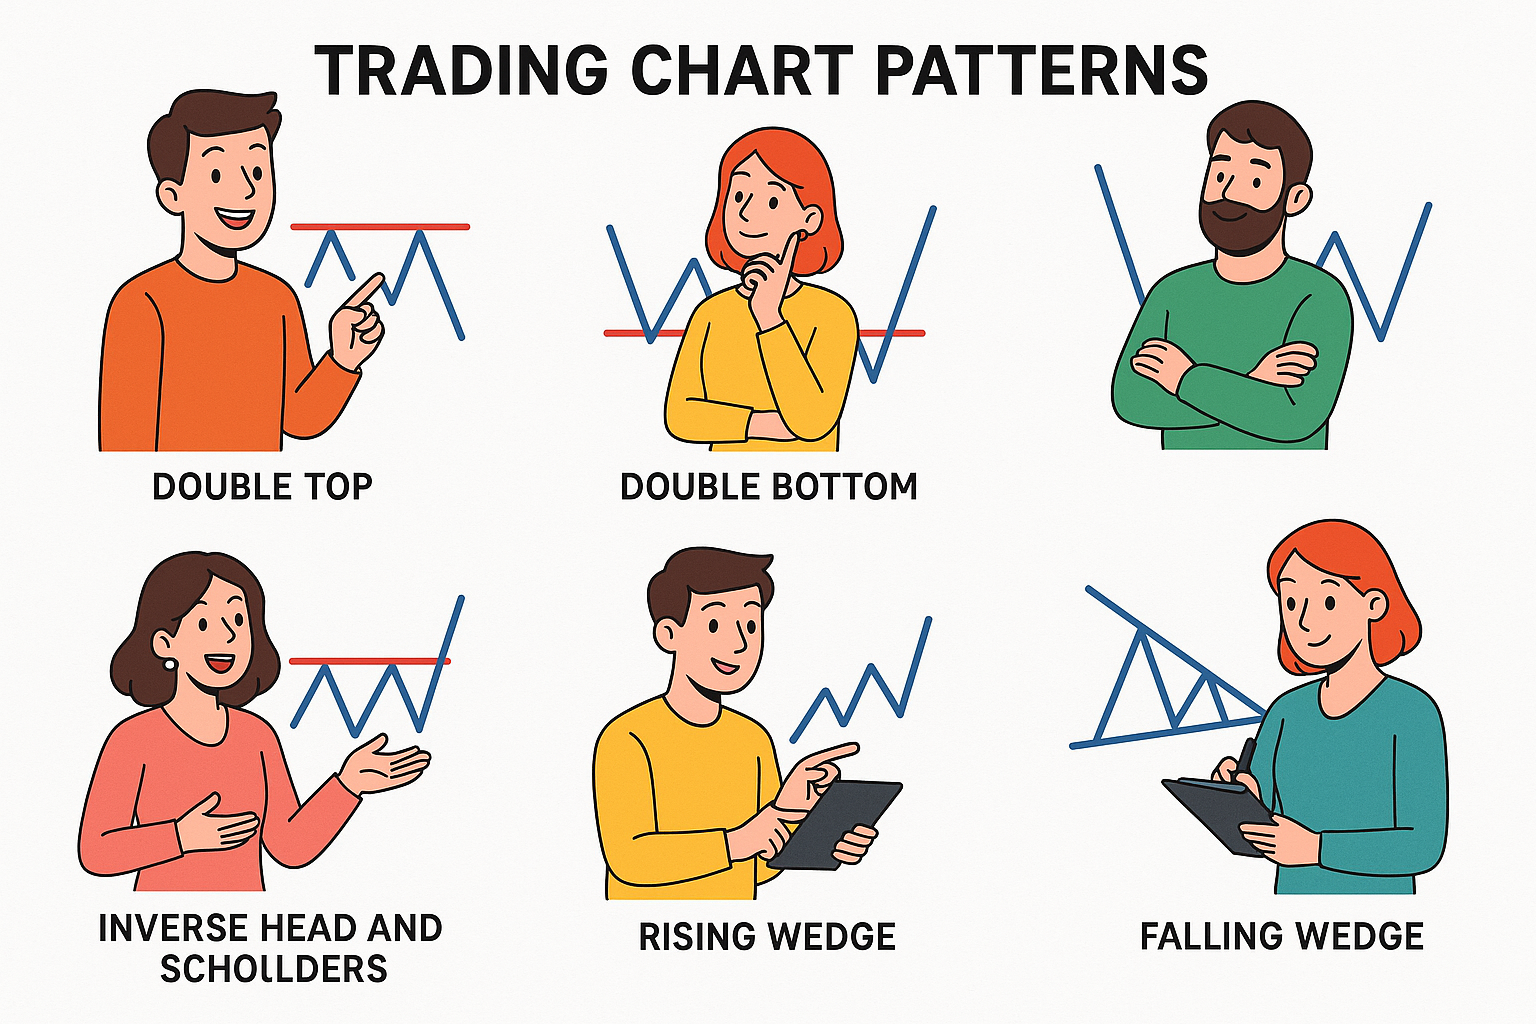
2. Double Tops
This pattern forms when the price hits a high, pulls back, and then tries to rally again only to fail at roughly the same level. That second rejection? It’s your warning shot. It signals that buyers are losing steam. When the price breaks down below the support (the low point between the two peaks), that’s the confirmation of a bearish reversal. Traders often look to enter short positions on the breakdown, anticipating further downward movement.
3.Lower Highs + Support Retests
This setup signals weakness creeping into the market. When the price consistently fails to push above previous highs creating lower highs it shows that buyers are losing momentum. At the same time, repeated retests of support suggest that level is under pressure. Think of it like a floor getting stomped on over and over eventually, it gives way. When support finally breaks, it often triggers a sharp drop as sellers take control and stop-losses start getting hit. This combo is a classic precursor to a bearish breakdown.

Trading meme coins is wild, but it’s not impossible. Train your eyes to spot these patterns, zoom out when in doubt, and don’t forget the golden rule: risk management over hype every time.
So whatever you decide, wherever your journey takes you always remember my motto “Do big things or do nothing at all.”
This is not financial advice always do your own research.
There are many more trading patterns to dive into, if you would like to see them let me know in the comments section and I will do my best to bring them here for you to take a look at.
keep smiling John Balding known as JOHN CRYPTO ENTHUSIAST